AI-agent platform startup · 2026
Revenue reporting and a forecast graded against actuals
Manual pipeline reporting replaced with live dashboards on one warehouse, plus a monthly forecast scored against what actually closed.
929 / 2,935 deals recovered by attribution fixes
The problem
Pipeline reporting was manual. Activity sat across six tools. Many deals had no rep credited, so scorecards undercounted the people doing the work. Nobody checked the forecast against what closed.
What I built
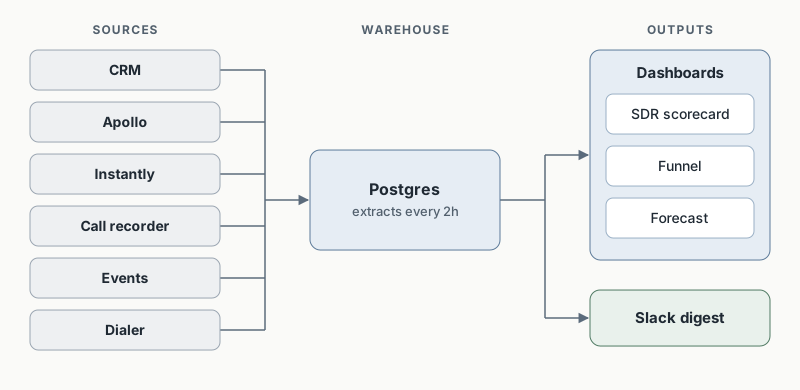
- SDR dashboard. Pulls activity per SDR from the dialer, the CRM, two sequencing tools, the events tool and the email marketing tool. It has a team funnel, a rep scorecard and an “Ask AI” layer for plain-language questions.
- Attribution fixes. Re-linked deals to the reps who sourced them. This recovered 929 of 2,935 deals, or 32%. SQLs are now dated by the day they qualified. Shared deals get half credit each.
- GTM intelligence dashboard. Meeting to SQL, SQL to close, a goal calculator for planning, and inbound bookings.
- Forecast calibration. I froze a v1 closed-won model and scored it against actuals each month.
- Monday digest. Month-to-date pacing for each of 12 SDRs, posted to Slack.
- Cross-sell view. A read-only CRM list. The acceptance test matched 51 of 51 deals.
Design decisions
- One warehouse, so every dashboard agrees on the numbers.
- The forecast is frozen before the month starts. You can’t grade a model you keep changing.
- Data extracts run every 2 hours. I cut the outbound-tool pull from about 4 minutes to about 23 seconds.
- I pruned the database from about 236 MB to about 118 MB to stay on the free plan.
- I code-reviewed my own dashboards. One review found 18 issues. 16 were confirmed and fixed.
Result
The first scored month landed about 2% below the low end of the forecast band. I recalibrated the band. Leadership now gets reporting that updates itself, credits the right reps, and comes with a forecast that has been tested against real results.